Research Article | | Peer-Reviewed

Comparative Analysis of Electrical Conductivity of Groundwater from Hand-dug Wells and Boreholes in Bida, Nigeria

Received: 11 May 2025     Accepted: 26 May 2025     Published: 13 June 2025
Views:       Downloads:
Abstract

The human body is composed of three-quarters of water, emphasizing the significant influence of water quality on our health. Consequently, it is essential to assess water quality in each lithologically distinct region. This research aimed to assess the Electrical Conductivity (σ) of water from Hand-dug Wells and Boreholes in Bida. A total of 40 samples, 20 from each source, were collected from key locations within Bida town. Analysis of the samples was performed using the Jenway DDS-307 conductivity meter, a versatile digital device adaptable to temperature changes through a probe. The mean σ values for Hand-dug Wells ranged from (260.00 ± 8.02) - (1335.67 ± 40.60) µS.cm−1. Borehole mean σ values varied from (33.53±0.67) - (1485.33±7.37) µS.cm−1. Among the 40 sampled Wells, nine (9) exceeded the benchmark, while six (6) approached the benchmark of 1000 µS.cm−1 specified by the Standard Organization of Nigeria (SON) and the World Health Organization (WHO) for drinking water. Consequently, in terms of σ as a drinking water standard, this study recommends that 15 sources (both Hand-dug and Boreholes) are unsuitable for drinking but may be utilized for other purposes. The study also suggests further investigation of physico-chemical parameters and radionuclide concentration of groundwater in Bida town.

Published in International Journal of Environmental Protection and Policy (Volume 13, Issue 2)
DOI 10.11648/j.ijepp.20251302.11
Page(s) 32-42
Creative Commons

This is an Open Access article, distributed under the terms of the Creative Commons Attribution 4.0 International License (http://creativecommons.org/licenses/by/4.0/), which permits unrestricted use, distribution and reproduction in any medium or format, provided the original work is properly cited.

Copyright

Copyright © The Author(s), 2025. Published by Science Publishing Group

Keywords

Electrical Conductivity, Borehole, Hand-dug Well, Groundwater, Bida

1. Introduction
According to the United Nations World Water Development Report, approximately 2 billion people, accounting for 26% of the global population, lack access to a safe drinking water supply . While ensuring access to potable water remains a core value in the United Nation’s Sustainable Development Goals (SDG-6) , the reality in many cities, towns, and villages in Nigeria is that a significant amount of time is spent in the pursuit of water. In most cases, the water is of questionable quality and sourced from distant locations .
Water plays a vital role in the ecosystem, supporting the life of all living organisms. Despite its extensive coverage of about 70% of the Earth’s surface, a considerable percentage of the global population, particularly in developing nations, faces challenges in accessing safe water . Factors such as high population density, inadequate sanitation practices, and insufficient enforcement of environmental sanitation laws have played a significant role in the pollution of water sources. Pollutants in well water can originate from various sources, primarily from municipal activities like leakages from liquid and solid waste landfills, industrial processes involving liquid waste tanks, pipeline leakages, oil fields, and brines, as well as agricultural practices leading to saline irrigation return flow.
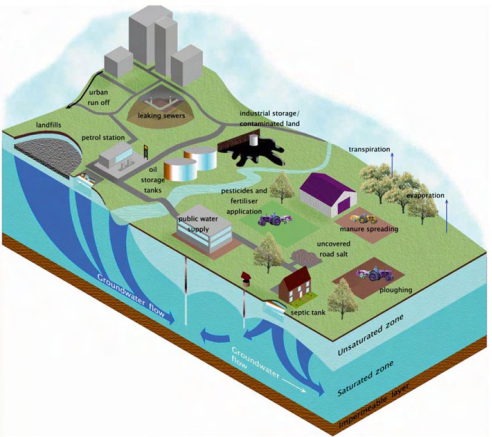
Figure 1. Sources of groundwater contamination an area showing different sources like urban runoff, pesticides and fertilizers, industrial waste, leaking sewers (Credit: UK Groundwater Forum Ref. ).
The acute water supply issues have prompted a substantial increase in the construction of hand-dug wells and boreholes, with some located close to septic systems and pit latrines. Throughout history, humans have employed various methods for waste disposal, including burning, direct placement in streams, storage on the ground, or burial. Human-induced impacts on surface water quality include not only direct waste discharge into streams but also contaminated surface runoff this is shown in Figure 1. Groundwater quality, meanwhile, is commonly influenced by waste disposal practices and land use. A significant source of contamination arises from storing waste materials in excavations, such as pits or mines which may eventually infiltrate water sources .
Over the past two decades, researchers have examined the environmental effects of municipal waste, rainwater, and heavy metals infiltrating through trash in municipal waste accumulate various chemical and biological substances into groundwater has been studied . Porous and permeable soils tend to transmit water and certain types of contaminants with relative ease to the aquifer. The slow movement of groundwater also affects the transport of contaminants, causing them to concentrate and form a plume due to their slow movement.
Contaminants present in this surface water can contaminate the groundwater system. Some wells rely on artificial recharge to increase the amount of water infiltrating an aquifer, often using water from storm runoff, irrigation, industrial processes, or treated sewage as illustrated in Figure 1. The quality of groundwater resources depends on the management of human waste in catchment areas, as well as the geological characteristics of an area. Therefore, it is crucial to obtain the physico-chemical characteristics of well water to compare and monitor water quality and determine necessary treatments .
In Nigeria, the lack of efficient water supply facilities has led individuals, educational institutions, industries, commercial outlets, and even governmental and non-governmental agencies to prospect underground water for drinking water. Due to problems associated with shallow wells, such as water drying out in the dry season, seepage, and susceptibility to contamination, there is a growing inclination towards drilling boreholes to tap into underground water sources. Boreholes are generally perceived to have fewer contaminants than hand-dug wells due to their increased depth and access to the aquifer rather than merely relying on the water table. Consequently, water from boreholes is often considered safe and is seldom subjected to treatment. However, the geological characteristics of a region also influence the level of water contamination or its freshness from boreholes. This emphasizes the importance of examining the water quality from these two vital groundwater sources that many people in the townships rely on for survival.
Pure water is a poor conductor of electric current and generally has low electrical conductivities. An increase in ion concentration, however, enhances the electrical conductivity of water. Generally, the amount of dissolved solutes in water determines the level of its conductivity. Electrical conductivity (σ) is a measure of the ionic process of a solution that enables the passage of current through it. The conductivity of water is therefore influenced by the existence of inorganic dissolved solids, which may include negatively charged ions (anions) such as chlorides, nitrates, sulfates, and phosphates, or positively charged ions (cations) like sodium, magnesium, calcium, iron, and aluminum . According to water standards set by the Standards Organization of Nigeria (SON), United States Environmental Protection Agency (US EPA), and the World Health Organization, the σ value should not exceed 1000 µS.cm−1 . Various standards are used to assess portable water quality, including physical and chemical properties like Total Dissolved Solids (TDS), Alkalinity, pH, and Radionuclide contents.
The primary source of drinking water in Bida and its surroundings is groundwater. It is noted that elevated concentrations of ions and heavy metals in groundwater contribute to higher levels of total dissolved solids (TDS), resulting in increased electrical conductivity. Limited research has been conducted on the electrical conductivity of water in the Bida region. Ndaigi’s study reported σ values ranging from 40.02 to 110.02 µS.cm−1 in rivers around Bida , while Olusola et al. found σ values of approximately 204 µS.cm−1 in certain hand-dug wells .
In the context of this study, a Hand-dug well represents a traditional shallow groundwater source prevalent in many rural areas of the world. These wells are manually excavated using local hand implements, as described by Watt . Typically, the average depth of such wells ranges from 5 to 20 meters. On the other hand, a Borehole is a narrow, drilled hole in the ground specifically designed to access underground resources like water. Boreholes are constructed through motorized drilling using a power drill head to reach the aquifer, as outlined by Gaaloul . The depth of boreholes can vary, ranging between 30 to over 100 meters, depending on the geo-logical characteristics of the area. Currently, no comprehensive comparison exists regarding water quality in hand-dug wells and boreholes in the investigated area, especially concerning conductivity as a parameter. Therefore, this study aims to provide a thorough assessment of electrical conductivity in both hand-dug wells and boreholes in Bida town.
2. Materials and Methods
2.1. Hydrogeology of the Study Area
The study area Bida town is located in Bida local govern- ment, Niger state, Nigeria along Lattitude 9.08044° N and Lon- gitude 6.0099° E with a human population of about 188,181 persons (2006 census) inhabiting 51 km2 area. The hydrogeology of the place consists of flatlying sandstone, mudstone, and Alluvium deposits of the river Niger floodplain .
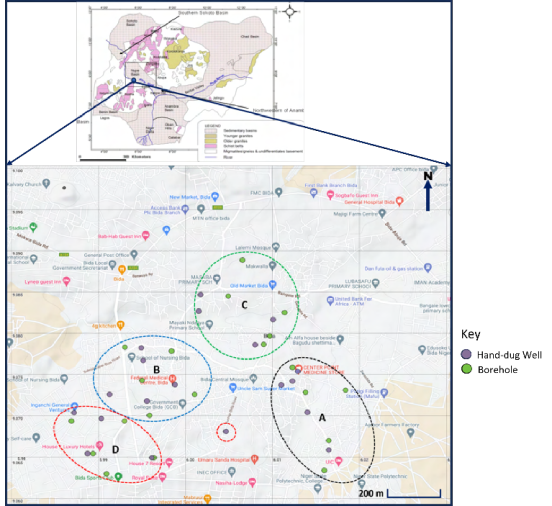
Figure 2. Sample collection location in Bida Town, Niger State, Nigeria (map of Nigeria modified from ) and Bida map modified from Google Map Maker (https://maps.co/map/65da067481178089318095slz53de8c).
The Bida sandstone is the basal sediment of the middle Niger Basin, consisting of the confined and unconfined major aquifers ranging between 3 and 34 m thickness composed of very fine to highly coarsely-grained, arkosic to feldspathic, with sandy silt- stones, claystone, and intraformational breccias . Bida is characterized by torrential rainfalls, infiltration, and percola- tion into the groundwater.
2.2. Method of Sample Collection
Forty (40) water samples, comprising twenty each from Hand-dug wells and Boreholes, were collected in meticulously cleaned plastic bottles from diverse locations: Areas surrounding (A) New Market and Niger State Polytechnic, (B) Federal Medical Center (FMC), (C) Old Market (FMC), and (D) Government Residential Area (GRA), as illustrated in the map in Figure 2. Physical visits were made to the Hand-dug wells and Boreholes, and water drawn directly from the sources was collected in the bottles, which were then rinsed with the same water to ensure sample integrity.
The coordinates for the Hand-dug Wells and Boreholes, from which the samples were sourced, were determined utilizing the Global Positioning System (GPS) integrated into the Android device. Details of these coordinates are shown in Table 1. Following sample collection, the samples were hermetically sealed, appropriately labeled for identification, and transported to the laboratory for subsequent analysis.
Table 1. GPS coordinates of Hand-dug wells and Boreholes in Bida Niger State, Nigeria.

Sample Area

Label

Hand-dug Lat.(° N)

Wells Long.(° E)

Label

Boreholes Lat.( ° N)

Long. (° E)

New Market

AW1

9.075397

6.012894

AB1

9.075861

6.012295

AW2

9.074206

6.012295

AB2

9.073109

6.018386

AW3

9.070426

6.014021

AB3

9.067011

6.016468

AW4

9.073761

6.011031

AB4

9.072839

6.013831

AW5

9.065867

6.016480

AB5

9.063426

6.015974

FMC

BW1

9.078222

5.994950

BB1

9.078320

5.993026

BW2

9.076694

5.995166

BB2

9.074305

5.995002

BW3

9.073773

5.998800

BB3

9.072594

6.001063

BW4

9.072594

5.991280

BB4

9.0778632

5.998387

BW5

9.071783

5.995590

BB5

9.0700711

5.995858

Old Market

CW1

9.079679

6.009702

CB1

9.082508

6.011398

CW2

9.078625

6.009742

CB2

9.084522

6.004925

CW3

9.084679

6.001743

CB3

9.079679

6.009702

CW4

9.081670

6.010071

CB4

9.078683

6.009011

CW5

9.082700

6.001529

CB5

9.088871

6.006547

GRA

DW1

9.070414

5.987224

DB1

9.069366

5.986905

DW2

9.069660

5.990350

DB2

9.069366

5.992986

DW3

9.065439

5.988748

DB3

9.065439

5.989408

DW4

9.064916

5.996152

DB4

9.064916

5.996392

DW5

9.068110

6.004680

DB5

9.062995

5.990932

2.3. Instrument and Measurement of Electrical Conductivity
2.3.1. DDS-307 Conductivity Meter
The DDS-307 is employed for measuring the electrical conductivity of liquids by determining the concentration of charge carriers, namely ions, within the liquid. The extent of conductivity in a given liquid is contingent upon the density of ions present in the solution per unit volume. Upon applying voltage across the electrode’s two points, namely the anode and cath- ode, negative ions (anions) migrate towards the positive pole (anode), moving away from the negative pole (cathode).
The DDS-307 meter comprises an electrode that is immersed in a liquid solution, as illustrated in Figure 3. When an electric current is applied, it results in conductance (G), which is the inverse of resistance (1R). According to fundamental physics, the resistivity (ρ) can be expressed in (2).
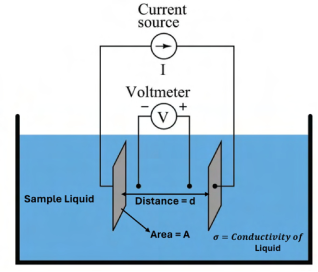
Figure 3. Description of conductivity measurement.
ρ =RAl(1)
and
1R=Aρl'(2)
where A is the Area of the electrode plate and l is the distance (d) between the electrodes. The conductance is then given by the (3) .
=1ρ×Ad(3)
Here 1ρ is the conductivity given by σ. The conductance G in Siemens (S) can now be written as
=σAd(4)
And
σ =GdA'(5)
A represents the area of the electrode plates in cm2, d denotes the distance between the plates in cm, and σ is the electrical conductivity measured in S.cm−1.
The plate geometry for a specific cell is commonly characterized by the ratio of distance to area (dA), denoted as the cell constant (k) and expressed in units of cm−1. The equation governing the calculation of k is provided in (6).
=Ad'(6)
For the DDS-307, k = 0.991 cm−1. Thus the electrical conductivity of a liquid measured using this instrument is given by (7):
σ = 0.991G(7)
The Jenway digital conductivity meter DDS-307 has a comprehensive measurement range spanning from 0.001 - 2 ×10⁵ µS.cm−1, with a measuring accuracy of ± 1%. This standard digital conductivity meter, illustrated in Figure 4, is equipped with a platinum black-model DJS-1C electrode and an integrated temperature probe. The temperature probe is capable of compensating for variations within the temperature range of 15-40°C during the measurement process.
2.3.2. Measurement of Electrical Conductivity
The Platinum black-model DJS-1C electrode of the conductivity meter was initially calibrated to its cell constant (k = 0.991) by adjusting the CAL knob of the instrument to the value of the cell constant. Following calibration, the meter’s knob was then switched to the measurement range mode. The electrode and temperature probe of the meter were immersed in each of the water samples. The temperature probe was inserted to regulate the changes in the temperature of the water. The conductivity value was then read and recorded for each water sample. The electrode and the temperature probe were cleaned with de-ionized water after each measurement to prevent cross- contamination. This procedure was repeated for three (3) sets of the same sample, and the mean value was subsequently calculated.
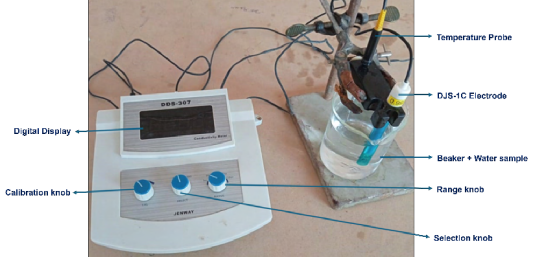
Figure 4. Set-up of DDS-307 for measurement of Electrical conductivity (σ) of water.
3. Results
The results of electrical conductivities of the water samples, analysed with the DDS-307 conductivity meter, from both Hand-dug wells and Boreholes in the Bida township are outlined in this section. The associated uncertainties considered are represented by the standard deviations.
Electrical Conductivity values for the CPMS area were measured and recorded in Table 2. The highest σ values for Hand-dug Wells were observed with sample AW4 (1120.67± 21.50) µS.cm−1, while the lowest values were recorded at (1120.67 ± 21.50) µS.cm−1. For Boreholes, AB5 exhibited the highest σ value at (1266.33 ± 6.66) µS.cm−1, and AB3 had the lowest at (155.33 ± 3.79) µS.cm−1. In general, σ values for Hand-dug Wells in Sabongida were relatively higher than those for Boreholes in the same area as shown in Figure 5, except for Borehole AB5, which exhibited a significantly elevated σ value.
Table 2. Measured electrical conductivity in Hand-dug wells and Boreholes at New Market Area.

Hand-dug Well

Borehole

Sample

σ ±S D (µS.cm−1)

Sample

σ ±S D (µS.cm−1)

AW1

330.00±3.61

AB1

844.00±4.00

AW2

418.00±3.00

AB2

555.33±7.39

AW3

935.00±28.35

AB3

155.33±3.79

AW4

1120.67±21.50

AB4

800.66±20.11

AW5

388.00±7.55

AB5∗∗

1266.33±6.66

Mean

638.67±12.80

Mean

724.33±8.39

∗ and ∗∗ are σ > 1000 µS.cm−1 for hand-dug wells and Boreholes respectively
Table 3. Measured electrical conductivity in Hand-dug wells and Boreholes at FMC Area.

Hand-dug Well

Borehole

Sample

σ ±S D (µS.cm−1)

Sample

σ ±S D (µS.cm−1)

BW1

1076.00±12.28

BB1∗∗

1485.33±7.37

BW2

898.33.00±23.46

BB2

415.33±2.08

BW3

260.33±8.02

BB3

468.00±5.29

BW4

1034.33±5.77

BB4

288.33±0.57

BW5

362.33±30.89

BB5∗∗

1244.66±1.53

Mean

732.80±16.08

Mean

780.33±3.37

∗ and ∗∗ are σ > 1000 µS.cm−1 for hand-dug wells and Boreholes respectively
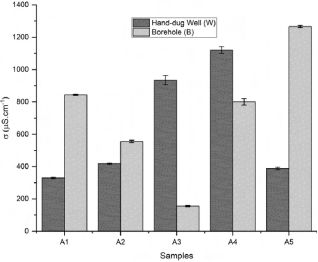
Figure 5. Comparison of electrical conductivity values of Hand-dug well and wells in New Market Area.
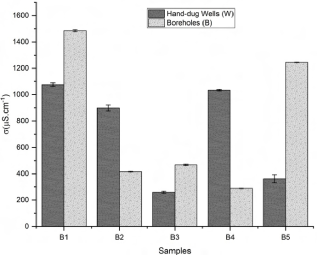
Figure 6. Comparison of electrical conductivity values of Hand-dug well and wells in FMC Area.
At location B around FMC, School of Nursing, and Government College areas, the conductivity values (σ) are recorded in Table 3. A graphical representation of the results is also depicted in Figure 6. Among the hand-dug well samples, BW1 exhibited the highest conductivity value at (1076.00 ± 12.28) µS.cm−1, while BW3 displayed the lowest at (260.33± 8.02) µS.cm−1. For borehole samples, BB1 and BB4 had the highest and lowest conductivity values at σ (1485.33 ± 7.37) and (288.33 ± 0.57) µS.cm−1, respectively. Notably, well samples BW1, BW4, and boreholes BB1 and BB5 exhibited conductiv- ity values surpassing the recommended limits.
The electrical conductivity values around Old Market and the surroundings were measured and recorded in Table 4. The obtained data revealed that sample CW2 had a conductivity value (σ) of (1131.67 ± 42.25) µS.cm−1, marking the highest for hand-dug wells in the area. Conversely, sample CW5, with (462.33±19.40) µS.cm−1, recorded the lowest σ for the hand-dug wells.
Table 4. Measured electrical conductivity in Hand-dug wells and Boreholes at Old Market Area.

Hand-dug Well

Borehole

Sample

σ ±SD (µS.cm−1)

Sample

σ ±SD (µS.cm−1)

CW1

569.33±5.86

CB1

33.53±0.67

CW2

1131.67±42.25

CB2

186.00±4.73

CW3

894.33±3.06

CB3

513.00±5.29

CW4

978.33±3.79

CB4

59.67±1.52

CW5

462.33±19.40

CB5

909.00±35.04

Mean

807.20±14.87

Mean

340.24±9.45

∗ and ∗∗ are σ > 1000 µS.cm−1 for hand-dug wells and Boreholes respectively
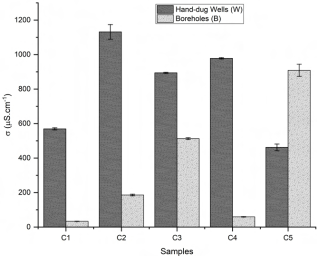
Figure 7. Comparison of electrical conductivity values of Hand-dug well and wells in Old Market Area.
Table 5. Measured electrical conductivity in Hand-dug wells and Boreholes at GRA.

Hand-dug Well

Borehole

Sample

σ ±SD (µS.cm−1)

Sample

σ ±SD (µS.cm−1)

DW1

511.67±21.36

DB1

780.33±10.50

DW2

1335.67±40.60

DB2

173.33±4.16

DW3

612.33±10.60

DB3

741.67±73.21

DW4

564.33±4.04

DB4

132.33±0.58

DW5

520.33±41.58

DB5

146.67±4.04

Mean

708.87±23.64

Mean

394.87±18.50

∗ and ∗∗ are σ > 1000 µS.cm−1 for hand-dug wells and Boreholes respectively
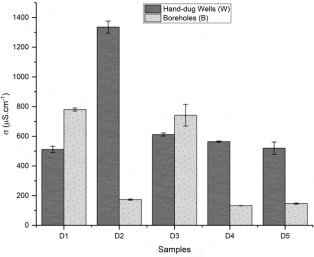
Figure 8. Comparison of electrical conductivity values of Hand-dug well and wells in GRA.
From Figure 7, Borehole samples CB5 and CB1 had the highest and lowest σ values at (909.00 ± 35.04) and (33.53±0.67) µS.cm−1, respectively. A graphical representation of the σ values in the sampled area exhibited significantly higher σ values in hand- dug wells than the boreholes in the vicinity.
Similarly, data obtained from the measurement of σ in the GRA of Bida revealed that Hand-dug wells samples DW2 and DW5 had the highest and lowest values, recorded as (1335.00±40.60) µS.cm−1 and (520.00±41.58) µS.cm−1, respectively (see Table 5 and Figure 8). In contrast, boreholes in the same area had lower conductivity values (σ), with DB1 and DB4 having the highest and lowest observed values at (780.33 10.50) and (132.33±0.58) µS.cm−1, respectively. Generally, the electrical conductivities of hand-dug wells were comparatively higher than those of the boreholes in this specific study area.
4. Discussion
Access to safe drinking water is crucial for maintaining good health, and various standards exist to assess water quality for this purpose, with Electrical Conductivity (σ) being one of the key physical parameters. In groundwater, σ indicates water salinity and requires careful monitoring, particularly in diverse geological regions, especially in urban areas. Therefore, this study assessed groundwater resources in the Bida area, with the following findings.
The σ values for Hand-dug wells in Bida Municipality varied from 260.33 (BW3) to 1335.67 (DW2) µS.cm−1. Hand-dug wells in Old Market (C) and its vicinity showed elevated σ values.
Specifically, Wells AW4, BW1, BW4, CW2, and DW2 surpassed the recommended limits set by SON, LASEPA, WHO, and US EPA for drinking water. Also, Wells AW3, BW2, CW3, and CW4 had σ values near the benchmark which calls for concern. Typically, Hand-dug wells, being shallow, may experience increased σ levels due to heightened runoff, infiltration, and percolation from dumpsites, potentially linked to domestic waste, leachates, and agricultural activities .
The measured electrical conductivities for Boreholes ranged from 33.53 (CB1) to 1485.33 (BB1) µS.cm−1. Specifically, samples AB5, BB1, and BB5 had σ values beyond the recommended limits, while AB1, AB4, and CB5 values were near the benchmark. Elevated levels of inorganic heavy metals in Boreholes are primarily influenced by the geological composition of the surrounding area where the water flows. Rivers and streams passing through regions with granite bedrock are often characterized with lower σ because granite comprises inert materials that do not ionize or dissolve into ionic components when introduced to water. Conversely, streams in areas with clay soils and siltstones tend to have higher σ due to the presence of materials that ionize upon entering the water . The impact of groundwater inflows on conductivity depends on the bedrock through which they flow. The hydrogeology of the Bida basin is characterized by claystone and siltstones . This formation also allows for the percolation of water into the underground aquifer. Hence, the observed high conductivity values in some of the Boreholes are not unusual.
In general, Hand-dug wells in the Bida area had higher σ values than Boreholes. The Borehole samples in the FMC area (BB1), recorded the highest σ value in this study, while CB1, a Borehole in the Old Market area (C), had the lowest σ value. The results did not reveal a clear pattern; however, it was noted that all measured σ values of Boreholes in Old Market and GRA were within acceptable limits. In contrast, Hand-dug wells sampled in locations A, B, C, and D all had at least one hand-dug well with elevated σ values beyond the recommended limits. While σ values themselves do not directly suggest harm to the population’s health, higher σ values indicate the presence of heavy metals and total dissolved solids in water. Some of these heavy metals or solutes may pose potential health risks to humans. Consequently, the measurement of σ in Bida township provides valuable insights that guide further investigations into water standards within the area. These results will aid in understanding the potential health implications and facilitate proactive measures to ensure the safety and quality of drinking water in the community.
5. Conclusion
In conclusion, this study has presented the electrical conductivity values of groundwater in Bida town. The findings indicate that five (5) Hand-dug wells and three (3) Boreholes exhibited elevated σ values, surpassing the recommended standards for safe drinking water set by local and international monitoring agencies. Moreover, four (4) Hand-dug wells and three (3) Boreholes approached the benchmark of 1000 µS.cm−1. Out of the 40 groundwater sources sampled, fifteen (15) are deemed unsuitable for drinking, encompassing those exceeding and nearing the benchmark. Nonetheless, these sources remain suitable for non-potable purposes. This study emphasized the importance of continuous monitoring and assessment of groundwater quality particularly physico-chemical parameters and radionuclide concentration of groundwater in Bida town to ensure the provision of potable water to the community and its environs. Also, the assessment of electrical conductivity in groundwater sources contributes essential baseline data, enhancing the existing database on groundwater quality parameters in the area. This data serves as a valuable addition to ongoing United Nations SDG-6 efforts to comprehensively understand and monitor the quality of groundwater, providing a foundation for informed decision-making and future research endeavors in the region.
Abbreviations

FMC

Federal Medical Centre

GPS

Global Positioning System

GRA

Governement Residential Area

LASEPA

Lagos State Environmental Protection Agency

SDG

Sustainable Development Goals

SON

Standard Organization of Nigeria

TDS

Total Dissolved Solids

USEPA

United States Environmental Protection Agency

WHO

World Health Organization

Acknowledgments
The authors sincerely acknowledge the contribution of the Federal University of Education Kontagora, Niger State, Nigeria (formerly Federal College of Education Kontagora, Niger State, Nigeria), and the Systematic Tracking of Exchanges in Procurement (STEP-B) World Bank project for procuring the equipment that facilitated this research. We also thank Mr. Joshua Mulero for his assistance during the measurements and Ms. L. I. Omokhoa, an expert in water resources management, whose inputs greatly contributed to the success of this work.
Conflicts of Interest
The authors declare no conflicts of interest.
Appendix
Raw data of Electrical conductivity (σ) of groundwater in Bida.
Table A1. Electrical Conductivity of Hand-dug Wells.

New Market

Electrical conductivity (µS/cm)

σ1

σ2

σ3

σ1

A1

333.0

326.0

331.0

330.00

A2

421.0

415.0

418.0

418.00

A3

967.0

913.0

925.0

935.00

A4

1142.0

1099.0

1121.0

1120.67

A5

396.0

381.0

387.0

388.00

FMC

Electrical conductivity (µS/cm)

σ1

σ2

σ3

σ1

B1

1085.0

1062.0

1081.0

1076.0

B2

906.0

872.0

917.0

898.33

B3

271.0

278.0

262.0

270.33

B4

1031.0

1041.0

1031.0

1034.33

B5

398.0

345.0

344.0

362.33

Old Market

Electrical conductivity (µS/cm)

σ1

σ2

σ3

σ¯ 1

C1

565.0

567.0

576.0

569.33

C2

1153.0

1083.0

1159.0

1131.70

C3

891.0

897.0

895.0

894.33

C4

974.0

980.0

981.0

978.33

C5

472.0

475.0

440.0

462.33

GRA

Electrical conductivity (µS/cm)

σ1

σ2

σ3

σ¯ 1

D1

524.0

524.0

487.0

511.67

D2

1371.0

1343.0

1291.0

1335.00

D3

622.0

601.0

614.0

612.33

D4

565.0

560.0

568.0

564.33

D5

497.0

495.0

568.0

520.00

Table A2. Electrical Conductivity of Boreholes.

New Market

Electrical conductivity (µS/cm)

σ1

σ2

σ3

σ¯ 1

A1

840.0

844.0

848.0

844.00

A2

558.1

547.0

561.0

555.33

A3

151.0

158.0

157.0

155.33

A4

795.0

823.0

784.0

800.67

A5

1262.0

1263.0

1274.0

1266.33

FMC

Electrical conductivity (µS/cm)

σ1

σ2

σ3

σ¯ 1

B1

1491.0

1488.0

1477.0

1485.33

B2

413.0

416.0

417.0

415.33

B3

474.0

466.0

464.0

468.00

B4

288.0

289.0

288.0

288.33

B5

1245.0

1246.0

1243.0

1244.67

Old Market

Electrical conductivity (µS/cm)

σ1

σ2

σ3

σ¯ 1

C1

33.8

34.1

33.7

33.50

C2

190.0

181.0

188.0

186.00

C3

517.0

507.0

515.0

513.00

C4

60.0

61.0

58.0

59.67

C5

911.0

873.0

943.0

909.00

GRA

Electrical conductivity (µS/cm)

σ1

σ2

σ3

σ¯ 1

D1

791.0

780.0

770.0

780.33

D2

172.0

178.0

170.0

173.33

D3

773.0

658.0

794.0

741.67

D4

133.0

132.0

132.0

132.33

D5

151.0

143.0

146.0

146.67

References
[1] Azoulay, A. (2023). Partnerships and cooperation for water — UN World Water Development Report 2023. Retrieved 2024-02-20, [Online] from
[2] Omer, S. (2024). Global water crisis: Facts, FAQs, and how to help. Retrieved 2024-02-20, from
[3] Efe, S. I., Ogban, F. E., Horsfall, M., Akporhonor, E. E. (2005). Seasonal varia- tions of physico-chemical characteristics in water resources quality in West- ern Niger Delta region, Nigeria., 9(1), Retrieved 2024-02-20, from
[4] Bordalo, A. A., Savva-Bordalo, J. (2007). The quest for safe drinking water: An example from Guinea-Bissau (West Africa)., 41(13), 2978– 2986, Retrieved from
[5] Daniel, T., Temaugee, S. (2017). Groundwater contamination and human health; the need for geophysical application. Empiricism, 3, 1-9.
[6] Temaugee, S. T., Wariebi, A., Saakorun, M. I. (2020). Seasonal variation of electrical conductivity of groundwater and its implication on the residents of lafia municipal area, Nasarawa state, Nigeria. International Journal of Environ- mental Protection and Policy, 8(1), 22-30,
[7] Egbinola, C. N., Amanambu, A. C. (2014). Groundwater contamina- tion in Ibadan, South-West Nigeria., 3(1), 448, Retrieved 2024- 02-20, from
[8] Ezeudu, E. C., Offor, C. C., Oli, C. C., Nzelu, A. S. (2024). Groundwater contamination and its potential health risk in oba community, anambra state, southeastern nige- ria: an index analysis approach. Environmental Chemistry and Ecotoxicology, 6, 1-14,
[9] Oyeku, O. T., Eludoyin, A. O. (2010). Heavy metal contamination of groundwater resources in a Nigerian urban settlement., 4(4),, Re- trieved 2024-02-20, from
[10] Richardson, S. D. (2001). Water Analysis. Anal. Chem., 73(12), 2719-2734,
[11] Bralower, T., Bice, D. (2023). Groundwater Contamination — EARTH 103: Earth in the Future. Retrieved 2024-02-20, from
[12] AtlasScientific (2022). What Is The Typical Water Conductivity Range? Retrieved 2024-02-20, from
[13] USEPA (2012). Water: Monitoring and assessment: What is conductivity and why is it important? United States Environmental Protection Agency. Retrieved 2024- 02-20, from
[14] SON (2015). Nigerian standard for drinking water quality. Nigerian Industrial Standard. Retrieved 2024- 02-20, from
[15] Ndaiji, M. (2021). Effect of urban runoff and human activities on some physico-chemical parameters of river landzun, bida, niger state, nige- ria. Federal University of Technology Minna, MSc. Dissertation. Re- trieved 2024-02-21, from
[16] Olabdode, O., Eduvie, M., Olaniyan, I. (2012). Evaluation of groundwater resources of the middle niger (bida) basin of nigeria. American Journal of Environmental Engineering, 2(6), 166-173,
[17] Watt, S., Wood, W. E. (1979). Hand dug wells and their construction.. Retrieved from
[18] Gaaloul, N., Eslamian, S., Ostad-Ali-Askari, K. (2018). Boreholes. In P. T. Bobrowsky B. Marker (Eds.), Encyclopedia of engineering geology (pp. 68–73). Cham: Springer International Publishing. Retrieved from
[19] Adeleye, D. (1974). Sedimentology of the fluvial bida sandstone (cre- taceous), nigeria. Sedimentary Geology, 12(1), 1-24,
[20] Aromolaran, O., Adebayo, A. (2022). Mineralogical, geochemical, and indus- trial appraisal of kaolinitic claystones in share area, northcentral nigeria. Arab J Geosci, 15(789), 1-14, Retrieved from
[21] Alabi, A., Garba, I., Danbatta, U., Najime, T. (2018). Depositional environment and paleo-redox indicator of the maastrichian-campanian clay in central bida basin, nw nigeria: Insight from geochemistry and sedimentology. Journal of Geosciences and Geomatics, 6(3), 147-152,
[22] Schiefelbein, S., Fried, N., Rhoads, K., Sadoway, D. (1998). A high- accuracy, calibration-free technique for measuring the electrical conduc- tivity of liq- uids. Review of Scientific Instruments, 69(9), 3308-3313, Retrieved from
[23] Kebede, S., Taye, M. T. (2021). Chapter 13 - groundwater scarcity and management in the arid areas in east africa. A. Mukherjee, B. R. Scanlon, A. Aureli, S. Langan, H. Guo, A. A. McKenzie (Eds.), Global groundwa- ter (p. 177-186). Elsevier. Retrieved from
[24] Rahaman, M., Fadiya, S., Adekola, S., Coker, S., Bale, R., Olawoki, O.,... Akande, W. (2019). A revised stratigraphy of the bida basin, nigeria. Journal of African Earth Sciences, 151, 67-81,
[25] LASEPA 2020. The Lagos State Standards for Drinking water quality. chrome-extension: //efaidnbmnnnibpcajpcglclefindmkaj/
Cite This Article
  • APA Style

    Temaugee, S. T., Kudu, H. M., Daniel, T. A., Umar, A., Akano, B. U., et al. (2025). Comparative Analysis of Electrical Conductivity of Groundwater from Hand-dug Wells and Boreholes in Bida, Nigeria. International Journal of Environmental Protection and Policy, 13(2), 32-42. https://doi.org/10.11648/j.ijepp.20251302.11

    Copy | Download

    ACS Style

    Temaugee, S. T.; Kudu, H. M.; Daniel, T. A.; Umar, A.; Akano, B. U., et al. Comparative Analysis of Electrical Conductivity of Groundwater from Hand-dug Wells and Boreholes in Bida, Nigeria. Int. J. Environ. Prot. Policy 2025, 13(2), 32-42. doi: 10.11648/j.ijepp.20251302.11

    Copy | Download

    AMA Style

    Temaugee ST, Kudu HM, Daniel TA, Umar A, Akano BU, et al. Comparative Analysis of Electrical Conductivity of Groundwater from Hand-dug Wells and Boreholes in Bida, Nigeria. Int J Environ Prot Policy. 2025;13(2):32-42. doi: 10.11648/j.ijepp.20251302.11

    Copy | Download

  • @article{10.11648/j.ijepp.20251302.11,
      author = {Samuel Terungwa Temaugee and Hauwa Mohammed Kudu and Theresa Avusuahi Daniel and Abubakar Umar and Benedict Ubawuike Akano and Akangbe Ramoni Lasisi and Clement Majebi Dania and Yusuf Koko Arzika and Abubakar Idris Dangana and Mohammed Abdullahi and Love Igbodefe Omokhoa},
      title = {Comparative Analysis of Electrical Conductivity of Groundwater from Hand-dug Wells and Boreholes in Bida, Nigeria},
      journal = {International Journal of Environmental Protection and Policy},
      volume = {13},
      number = {2},
      pages = {32-42},
      doi = {10.11648/j.ijepp.20251302.11},
      url = {https://doi.org/10.11648/j.ijepp.20251302.11},
      eprint = {https://article.sciencepublishinggroup.com/pdf/10.11648.j.ijepp.20251302.11},
      abstract = {The human body is composed of three-quarters of water, emphasizing the significant influence of water quality on our health. Consequently, it is essential to assess water quality in each lithologically distinct region. This research aimed to assess the Electrical Conductivity (σ) of water from Hand-dug Wells and Boreholes in Bida. A total of 40 samples, 20 from each source, were collected from key locations within Bida town. Analysis of the samples was performed using the Jenway DDS-307 conductivity meter, a versatile digital device adaptable to temperature changes through a probe. The mean σ values for Hand-dug Wells ranged from (260.00 ± 8.02) - (1335.67 ± 40.60) µS.cm−1. Borehole mean σ values varied from (33.53±0.67) - (1485.33±7.37) µS.cm−1. Among the 40 sampled Wells, nine (9) exceeded the benchmark, while six (6) approached the benchmark of 1000 µS.cm−1 specified by the Standard Organization of Nigeria (SON) and the World Health Organization (WHO) for drinking water. Consequently, in terms of σ as a drinking water standard, this study recommends that 15 sources (both Hand-dug and Boreholes) are unsuitable for drinking but may be utilized for other purposes. The study also suggests further investigation of physico-chemical parameters and radionuclide concentration of groundwater in Bida town.},
     year = {2025}
    }
    

    Copy | Download

  • TY  - JOUR
    T1  - Comparative Analysis of Electrical Conductivity of Groundwater from Hand-dug Wells and Boreholes in Bida, Nigeria
    AU  - Samuel Terungwa Temaugee
    AU  - Hauwa Mohammed Kudu
    AU  - Theresa Avusuahi Daniel
    AU  - Abubakar Umar
    AU  - Benedict Ubawuike Akano
    AU  - Akangbe Ramoni Lasisi
    AU  - Clement Majebi Dania
    AU  - Yusuf Koko Arzika
    AU  - Abubakar Idris Dangana
    AU  - Mohammed Abdullahi
    AU  - Love Igbodefe Omokhoa
    Y1  - 2025/06/13
    PY  - 2025
    N1  - https://doi.org/10.11648/j.ijepp.20251302.11
    DO  - 10.11648/j.ijepp.20251302.11
    T2  - International Journal of Environmental Protection and Policy
    JF  - International Journal of Environmental Protection and Policy
    JO  - International Journal of Environmental Protection and Policy
    SP  - 32
    EP  - 42
    PB  - Science Publishing Group
    SN  - 2330-7536
    UR  - https://doi.org/10.11648/j.ijepp.20251302.11
    AB  - The human body is composed of three-quarters of water, emphasizing the significant influence of water quality on our health. Consequently, it is essential to assess water quality in each lithologically distinct region. This research aimed to assess the Electrical Conductivity (σ) of water from Hand-dug Wells and Boreholes in Bida. A total of 40 samples, 20 from each source, were collected from key locations within Bida town. Analysis of the samples was performed using the Jenway DDS-307 conductivity meter, a versatile digital device adaptable to temperature changes through a probe. The mean σ values for Hand-dug Wells ranged from (260.00 ± 8.02) - (1335.67 ± 40.60) µS.cm−1. Borehole mean σ values varied from (33.53±0.67) - (1485.33±7.37) µS.cm−1. Among the 40 sampled Wells, nine (9) exceeded the benchmark, while six (6) approached the benchmark of 1000 µS.cm−1 specified by the Standard Organization of Nigeria (SON) and the World Health Organization (WHO) for drinking water. Consequently, in terms of σ as a drinking water standard, this study recommends that 15 sources (both Hand-dug and Boreholes) are unsuitable for drinking but may be utilized for other purposes. The study also suggests further investigation of physico-chemical parameters and radionuclide concentration of groundwater in Bida town.
    VL  - 13
    IS  - 2
    ER  - 

    Copy | Download

Author Information
  • Department of Physics, Federal University of Education Kontagora, Kontagora, Nigeria; School of Physics, University of the Witwatersrand, Johannesburg, South Africa

  • School of Physics, University of the Witwatersrand, Johannesburg, South Africa

  • Department of Physics, Kebbi State University of Science and Technology, Aliero, Nigeria; Department of Physics, Ahmadu Bello University, Zaria, Nigeria

  • School of Physics, University of the Witwatersrand, Johannesburg, South Africa

  • School of Physics, University of the Witwatersrand, Johannesburg, South Africa

  • School of Physics, University of the Witwatersrand, Johannesburg, South Africa

  • School of Physics, University of the Witwatersrand, Johannesburg, South Africa

  • School of Physics, University of the Witwatersrand, Johannesburg, South Africa; Department of Physics, Kebbi State University of Science and Technology, Aliero, Nigeria

  • School of Physics, University of the Witwatersrand, Johannesburg, South Africa

  • School of Physics, University of the Witwatersrand, Johannesburg, South Africa

  • Department of Water Resource Management and Agrometeorology, Federal University of Agriculture, Abeokuta, Nigeria